Tutorial: Measure pixel area
This Tutorial explains how to use the measure pixel area script for Photoshop
Description site: Measure pixel area
Script download: Zip Archive
Description:
This tutorial is shows a complete workflow, from merging google map screenshots, getting measurements from the merged picture and using the collected data to make graphical pie charts in Adobe Illustrator. The tutorial has been done in CS5 but works in CS6 the same.
You can download the original files used in this tutorial as a zip archive here.
Author and copyright: Florian Frank
I. Merge screenshots:
- Using Google Maps, Bing Maps or similar websites, you can make screenshots of the displayed maps. It is important for the following steps to use a satellite picture without labels. Also very important: the map zoom has to be the same for every taken screenshot. The screenshots have to be cleaned from the scale bar and any other graphic that is not part of the satellite image.
Windows 7: Use the "Snipping-Tool" to select a screen area of the satellite image and save the screenshot.
Mac OSX: Use "⌘ + Shift + 4"to make screenshot from a selected screen area.
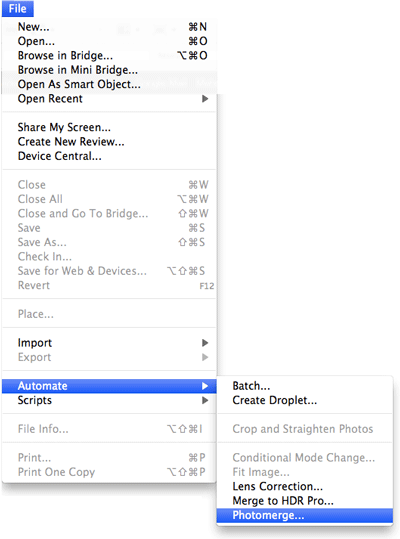
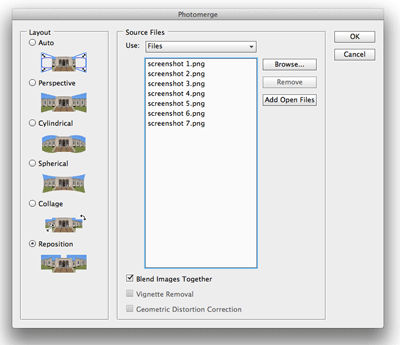
TIP: Use a high zoom on the map in order to obtain a high resolution picture when merging. Obviously you have to take more screenshots to cover the same area. - Open Photoshop and go to "File - Automate - Photomerge...". In the following dialog window choose "Reposition" and browse for the prepared screenshot files. Start the merging with a click on "OK".
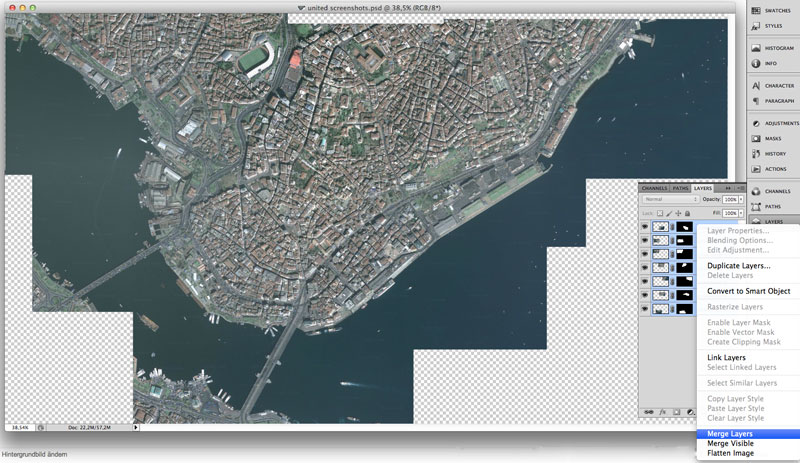
- After "Photomerge..." processed the screenshots and merged them to a united screenshot, select all the layers on the layer panel. Click on the right mouse button and choose "Merge Layers".
- A very important step is to optimize color contrasts in this image file, to get better results on the color selection later on.
First create a new "Levels..." adjustment layer. (4th symbol from left on the bottom of the "Layers" panel like in the picture below).
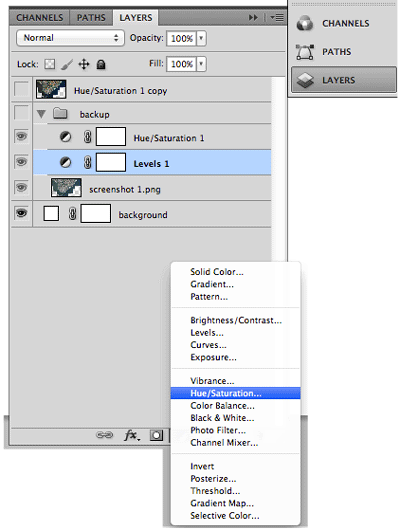
The "auto" setting in the "Levels..." dialog window works very well, so choose that to save time.
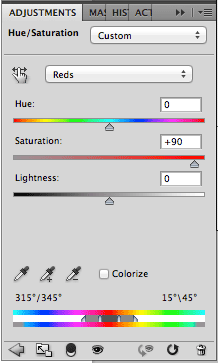
Second step is to make a new adjustment layer of type "Hue/Saturation...". On this you have to spend a little more time and try to find the right settings for your picture. In the files used in this tutorial the values are:
Red - Saturation +90,
Green - Saturation +70,
Cyan - Saturation - 100 and
Blues - Saturation +70.
These settings vary from screenshots of different online maps. Try to find your own settings, but this is a good start. - It is very useful to make a copy of the united screenshot with the two adjustment layers and place them in a folder with name "backup". You might have to change some settings there if the color selection is not working for you in the subsequent steps.
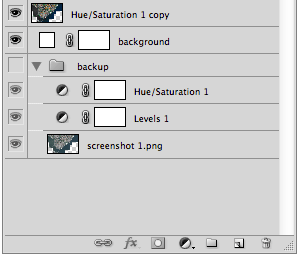
Hide the backup folder and create a white solid layer for a white background. Select and merge the remainging copied layer of the united screenshot and the two adjustment layers (e.g. step 3). The remaining Layers of this 5th step should look like in the picture below.
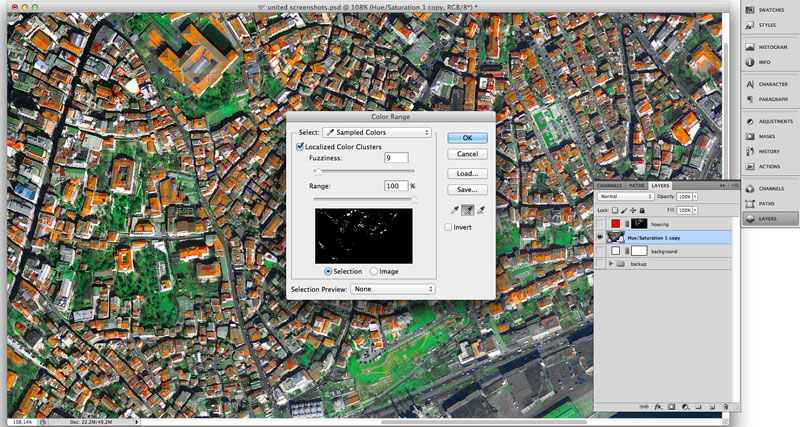
This merged layer should give you the united screenshot with the levels and hue adjustments. This picture is now ready to start with the color selection. Select the merged layer wit the your map and choose "Select - Color Range..." from the menu bar. With the eye-dropper click on the color you want to pick and use the "eye-dropper +" symbol to add colors to a selection. With a low Fuzziness setting is good and the Range should be set to around 10%. The picture below shows the obtained selection of the building roofs by picking different red tones in the picture. In this case a range of 100% worked well.
Also this step requires a lot of tries to get the best result.
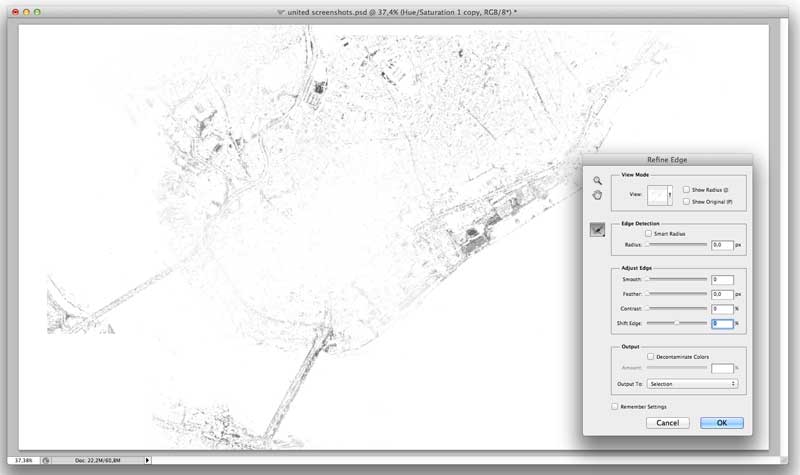
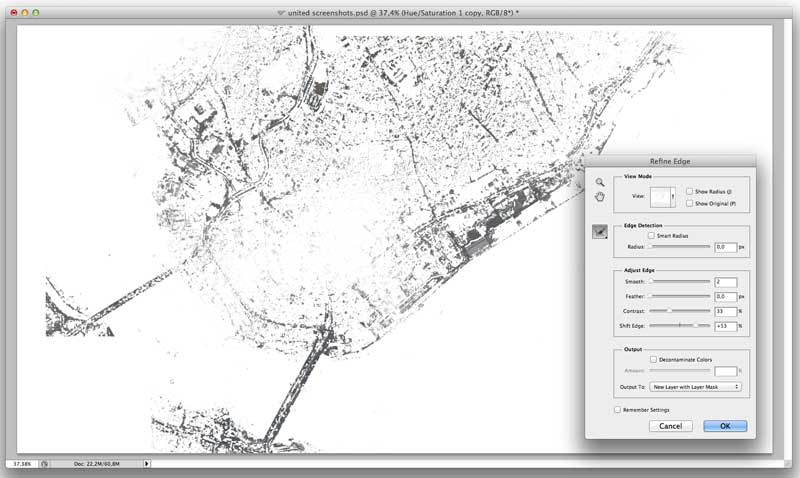
- This step helps you optimize the selection after completing step 5. Choose "Select - Refine Mask..." and a dialog box shows up like in the picture below. here you can try different settings on "Shift Edge", "Smooth" and "Contrast". This step improves the selection a lot. The values used in the picture below are: Contrast 33%, Shift Edge +53% and Smooth 2.
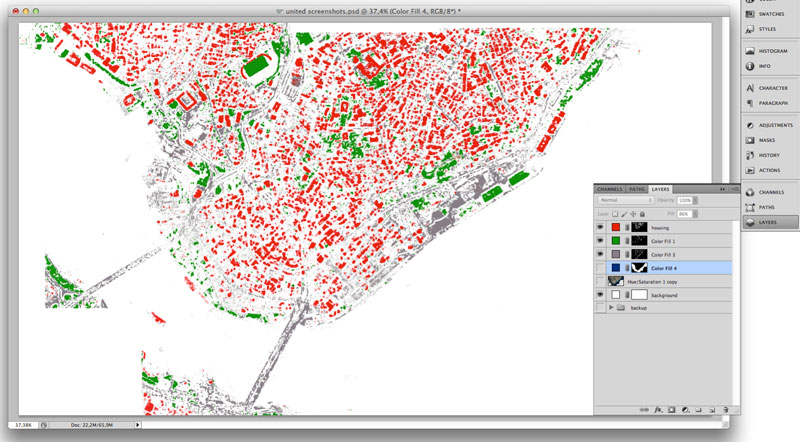
- After the selection is satisfying you can save the selection by creating a new "Solid Layer" (fill or adjustment layer menu shows the red arrow).
Use different fill colors for these layers and you get a new colored map like in the picture below. Important is to keep the layer mask on the "Solid Color Layers". You can get the selection from which you made these layers by clicking with "Ctrl" (Windows) or "⌘" (Mac) on the layer mask symbol in the layer panel and optimize again (like in step 6).
TIP: If you want to make a quick retouching on some parts of the mask use the brush tool and brush black or white color to the "Layer Mask". Be sure you have selected the Layer Mask and not the Layer before you begin to brush on the image.
II. Use the Measure pixel area script:
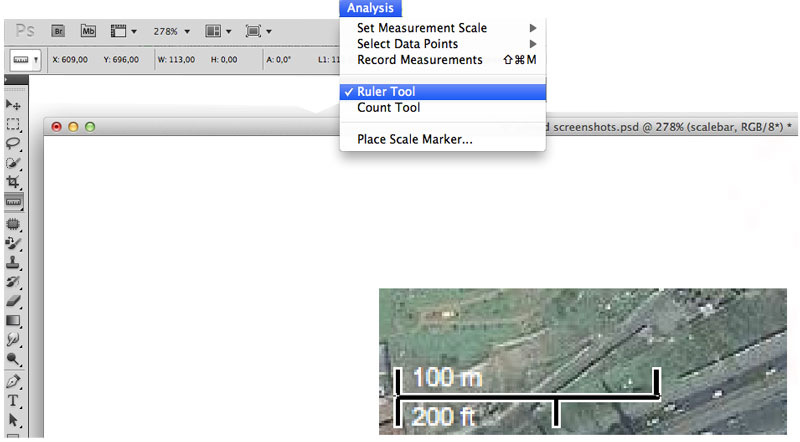
- To get the right scale place a small screenshot of the scale bar to the same photoshop file. This screenshot has to be taken at the same zoom level as the other screenshots from the online map. Use the "Ruler Tool" to get the length of the bar. In the example below the 200 ft marker is equal to 133 pixel. Remember these values and hide the placed scale bar image as you don't need it anymore.
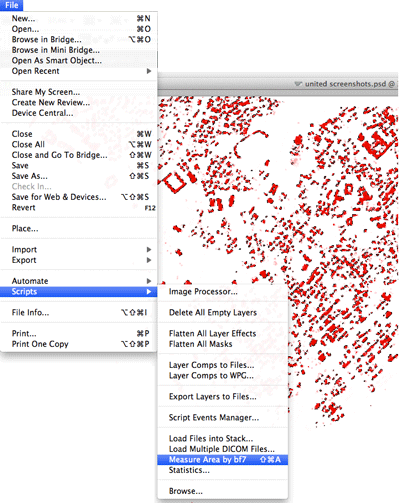
- Make a selection by clicking with "Ctrl" (Windows) or "⌘" (Mac) on the Layer Mask of one of the stored color selections. In the example below the red layer which shows the building roofs. Then go to "File - Scripts - Measure Area by bf7" or use the Shortcut.
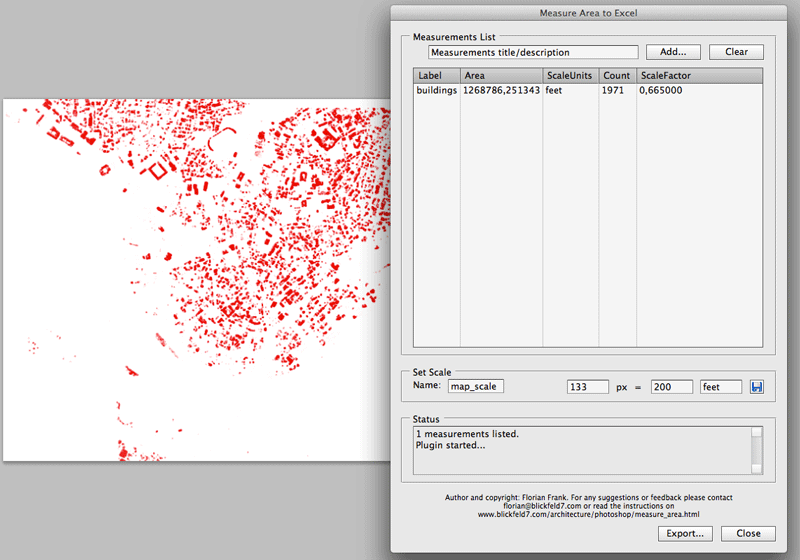
- On this dialog box you can set the scale which in our case is 133px = 200 feet according to the results of step 1. It is necessary to set a name (e.g. map_scale) and click on the blue floppy-disc symbol button next to these fields, in order to save this scale.
Once you have set the scale all following measurements will be taken at this scale. Save the measurement of the selection by typing a name in the input field on the top and click on "Add..." to save it. The picture below shows how it should look like, when measuring the red layer from the example files.
Sometimes an annoying warning shows up when the measurement is saving. This is normal due to the high amount of closed selection areas. The selection is working correctly also if this warning shows up. Close the "Measure Area to Excel" dialog and go on with your other prepared color selections.
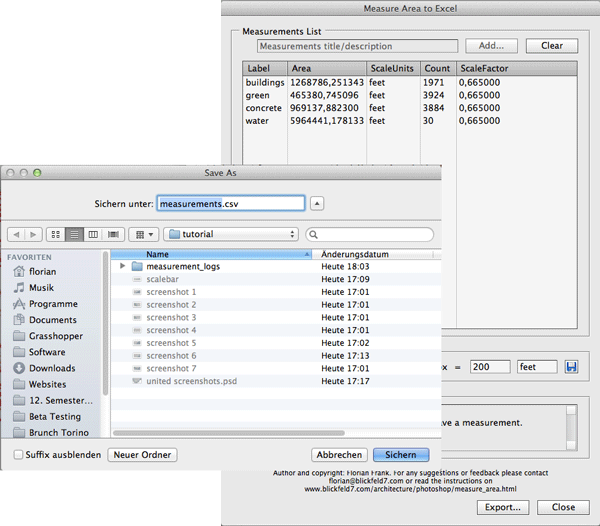
- Repeat step 3 as often you need to save all your seperated color selections and open the Measure pixel area window. Click on "Export..." to save a .csv file. This will save all your measurements to an Excel file.
You can delete your log files or keep them. If you delete them, the measurements will disappear in your list, the next time you open the dialog box.
III. Illustrator pie charts:
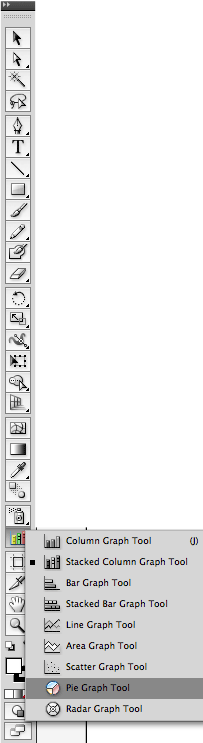
- Open Illustrator and create a new empty file. In the tool menu choose the Pie Graph Tool like in the lower left picture. Select the area for the size of your pie chart and click to complete. On the right picture it shows how it should look like if you don't have any data added to the pie chart.
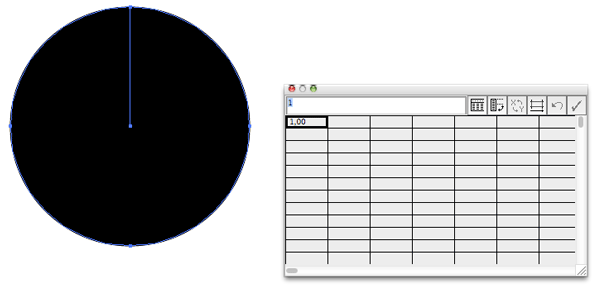
- Now open the .csv file which you have saved with the Measure pixel area tool in Photoshop (see chap. II. step 4). Copy the content of the columns "Description" and "Area" and paste it to the empty table on the pie graph in Illustrator.
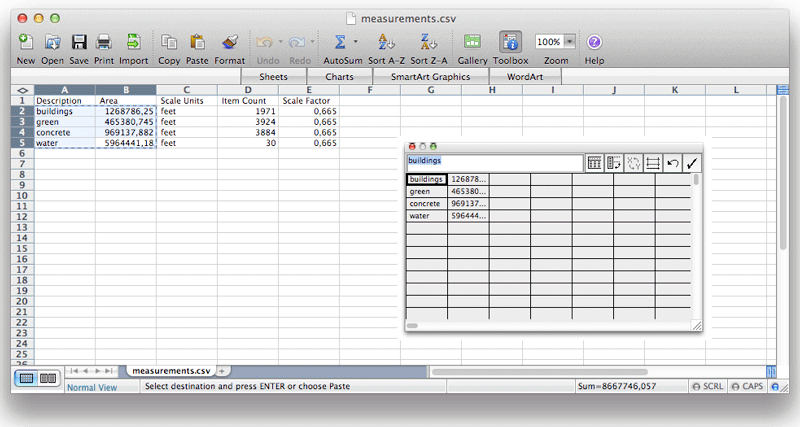
Then click on the 2nd symbol on the top bar of the table (red arrow) and subsequently on the check mark button (blue arrow). The result should look similar to the picture below.
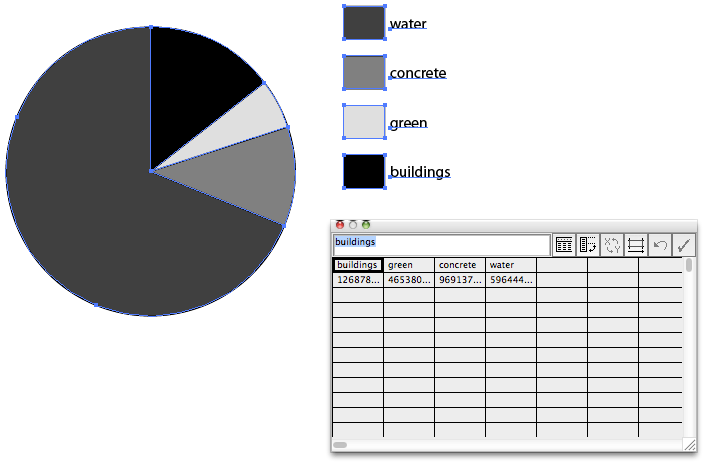
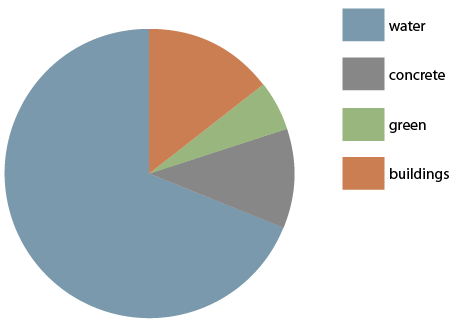
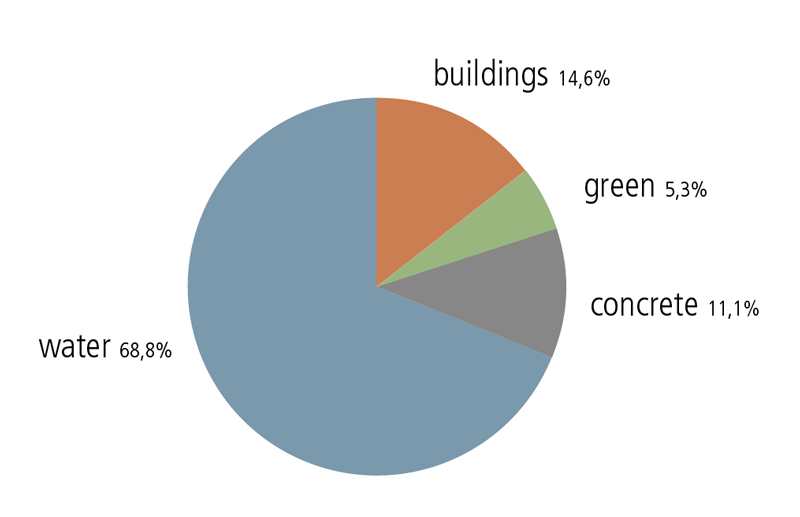
- From this point on you can change the graphic in any way you like. Select the pie chart and ungroup the graphic to change colors (e.g. picture below).
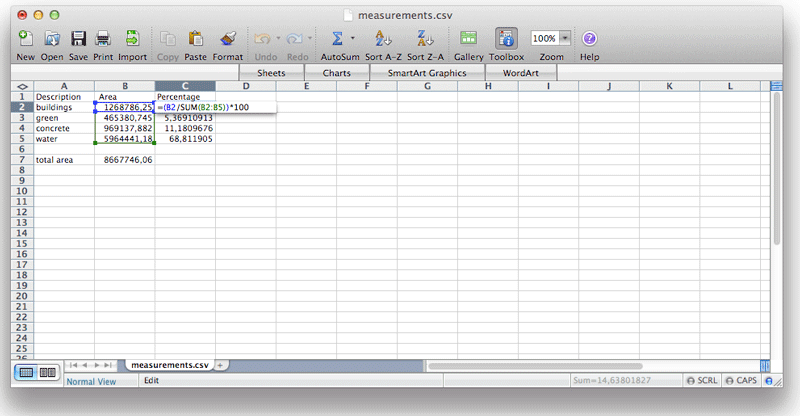
- In Excel you can use the data to calculate percentages and use those for making the pie charts.
IV. Example Project:
This is a project example where the techniques in this tutorial were used. The pdf shows an analysis of different parts of Istanbul and was done for a seminar entitled "Boom & Bloom" by Sulan Kolatan held at RPI, Troy NY (Spring 2011).